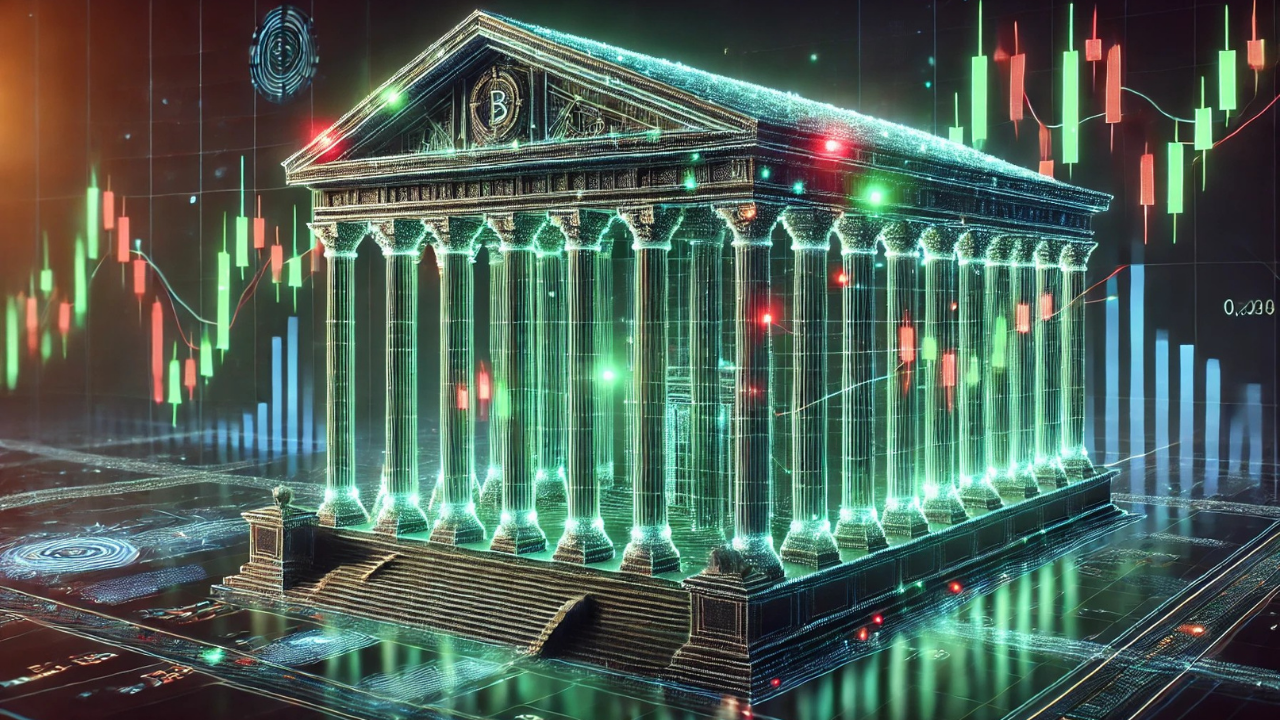
Ethereum (ETH) is showing signs of renewed strength after a period of sideways movement following its strong performance in early May. Despite recent price consolidation, mounting institutional interest and several bullish technical indicators suggest that ETH may be preparing for another significant breakout.
Institutional Inflows Signal Confidence
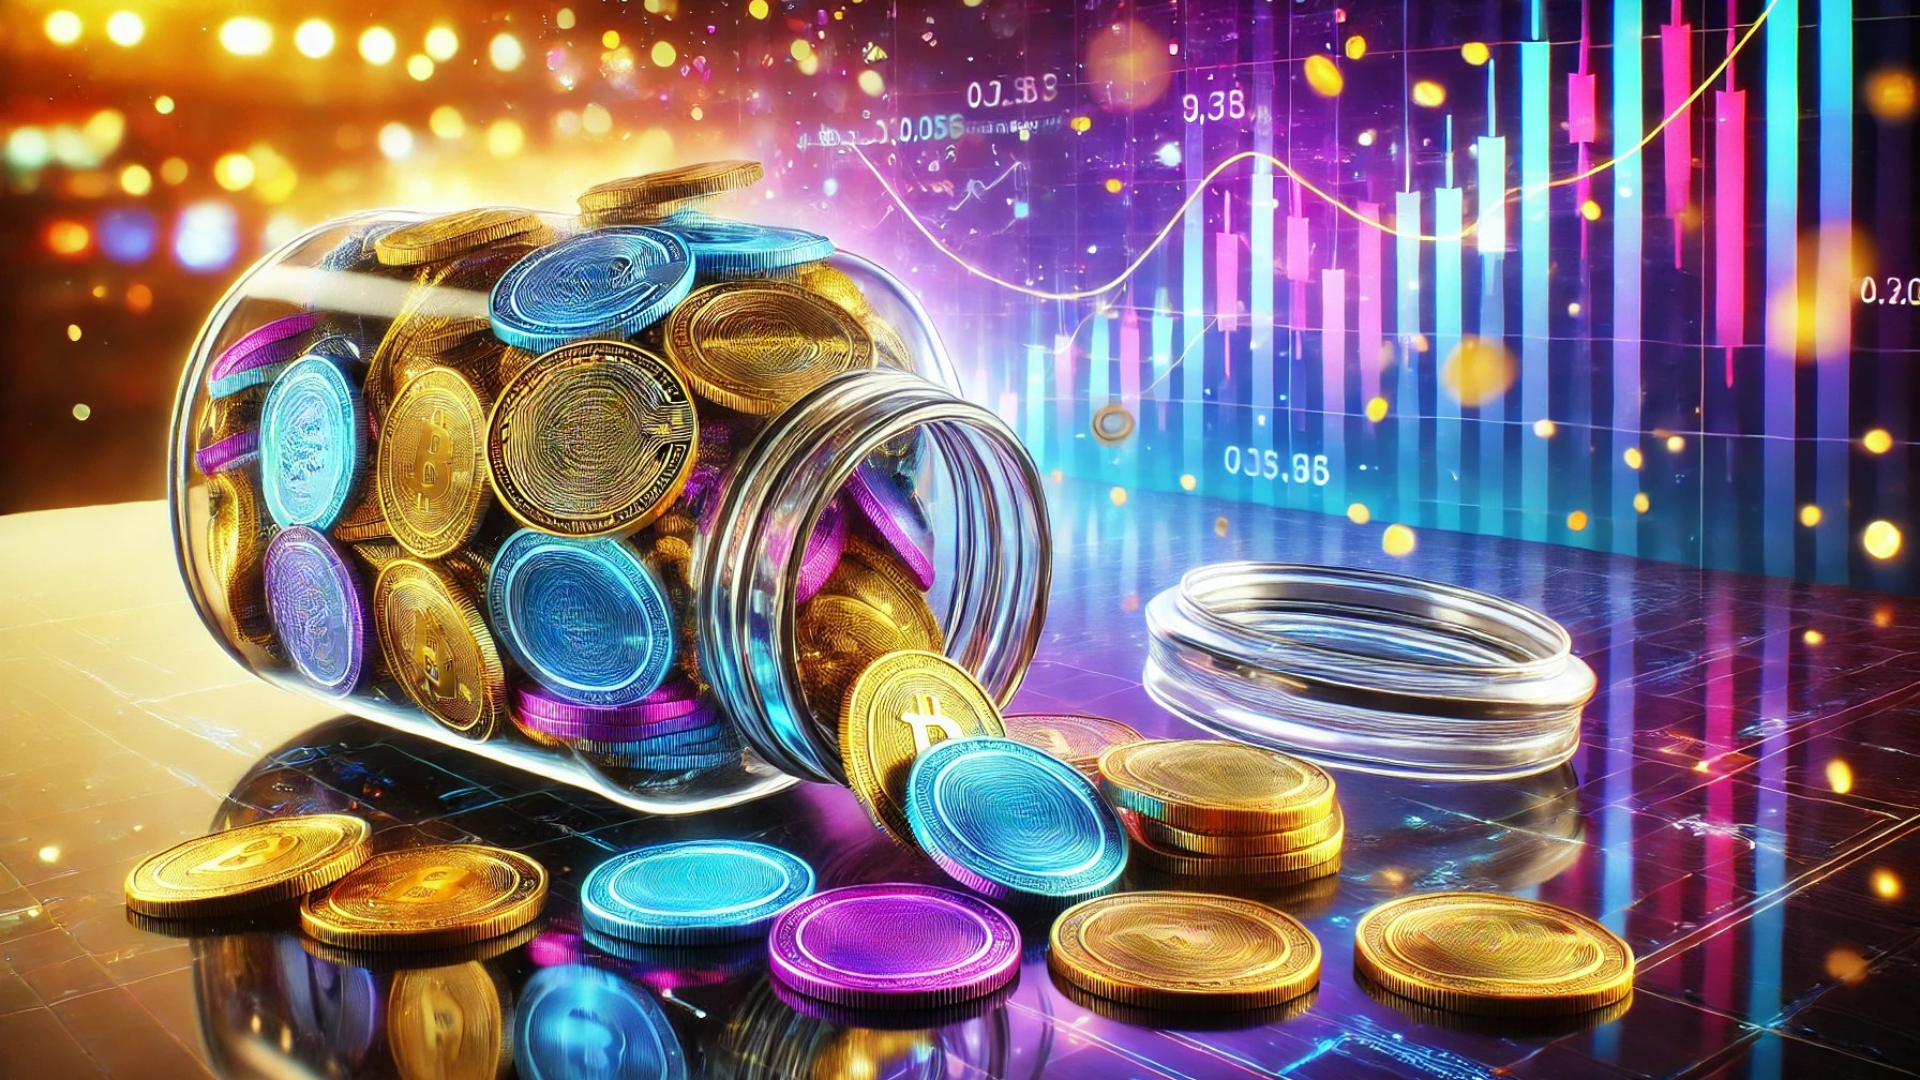
As of Thursday, Ethereum was trading around \$2,630, maintaining a tight range for over a month. Even within this consolidation, ETH remains nearly 90% above its 2025 low, showing remarkable resilience. Institutional investors are increasingly backing the asset, with spot Ethereum ETFs reporting \$56.9 million in inflows on Wednesday the 13th consecutive day of positive flows. These products have now posted gains for three straight months, pointing to growing Wall Street interest in Ethereum as a core crypto asset.
Dominance in Real-World Assets and DeFi
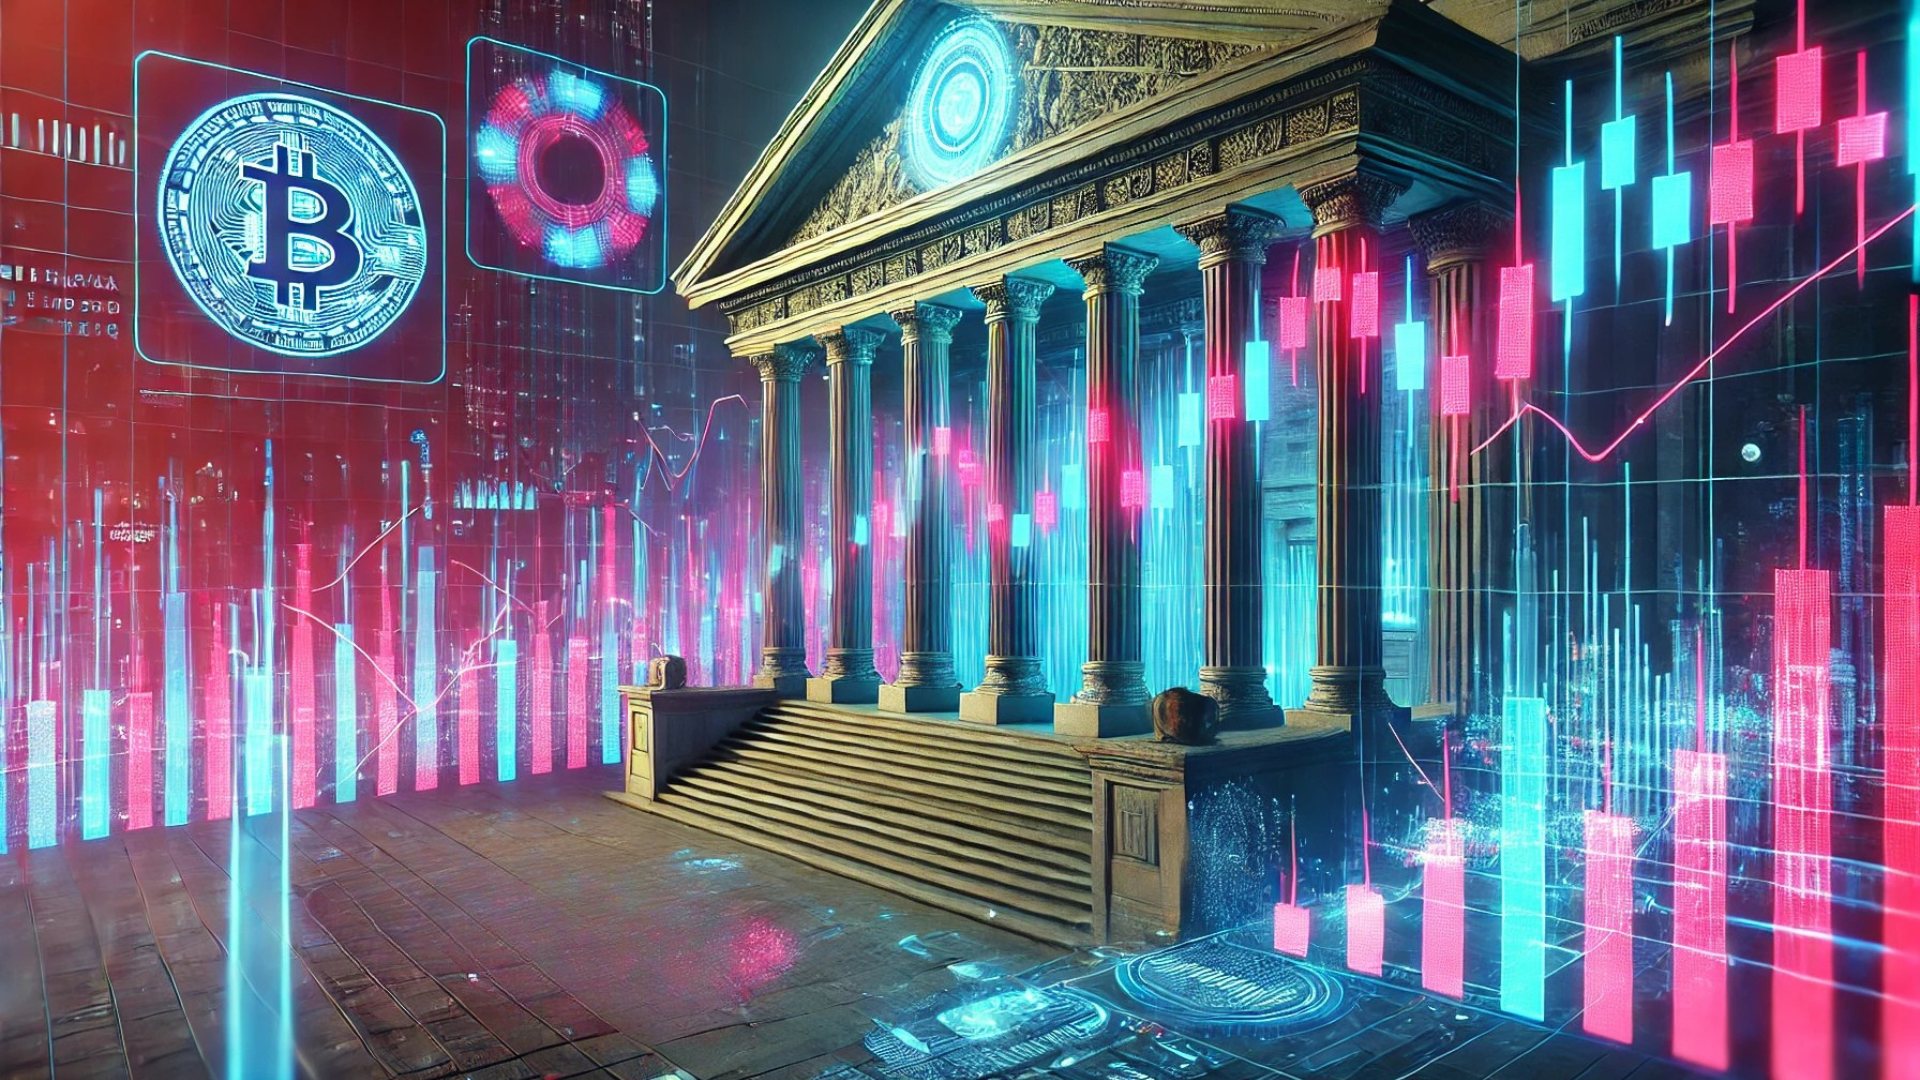
Beyond price movement, Ethereum continues to lead in blockchain utility. It holds the lion’s share of the real-world asset (RWA) market, with over \$7.375 billion of the \$23 billion sector hosted on its network. This puts it well ahead of competitors like ZKsync Era, Stellar, and Solana. Ethereum is also the dominant force in the stablecoin space, anchoring over \$129 billion in digital dollar assets.
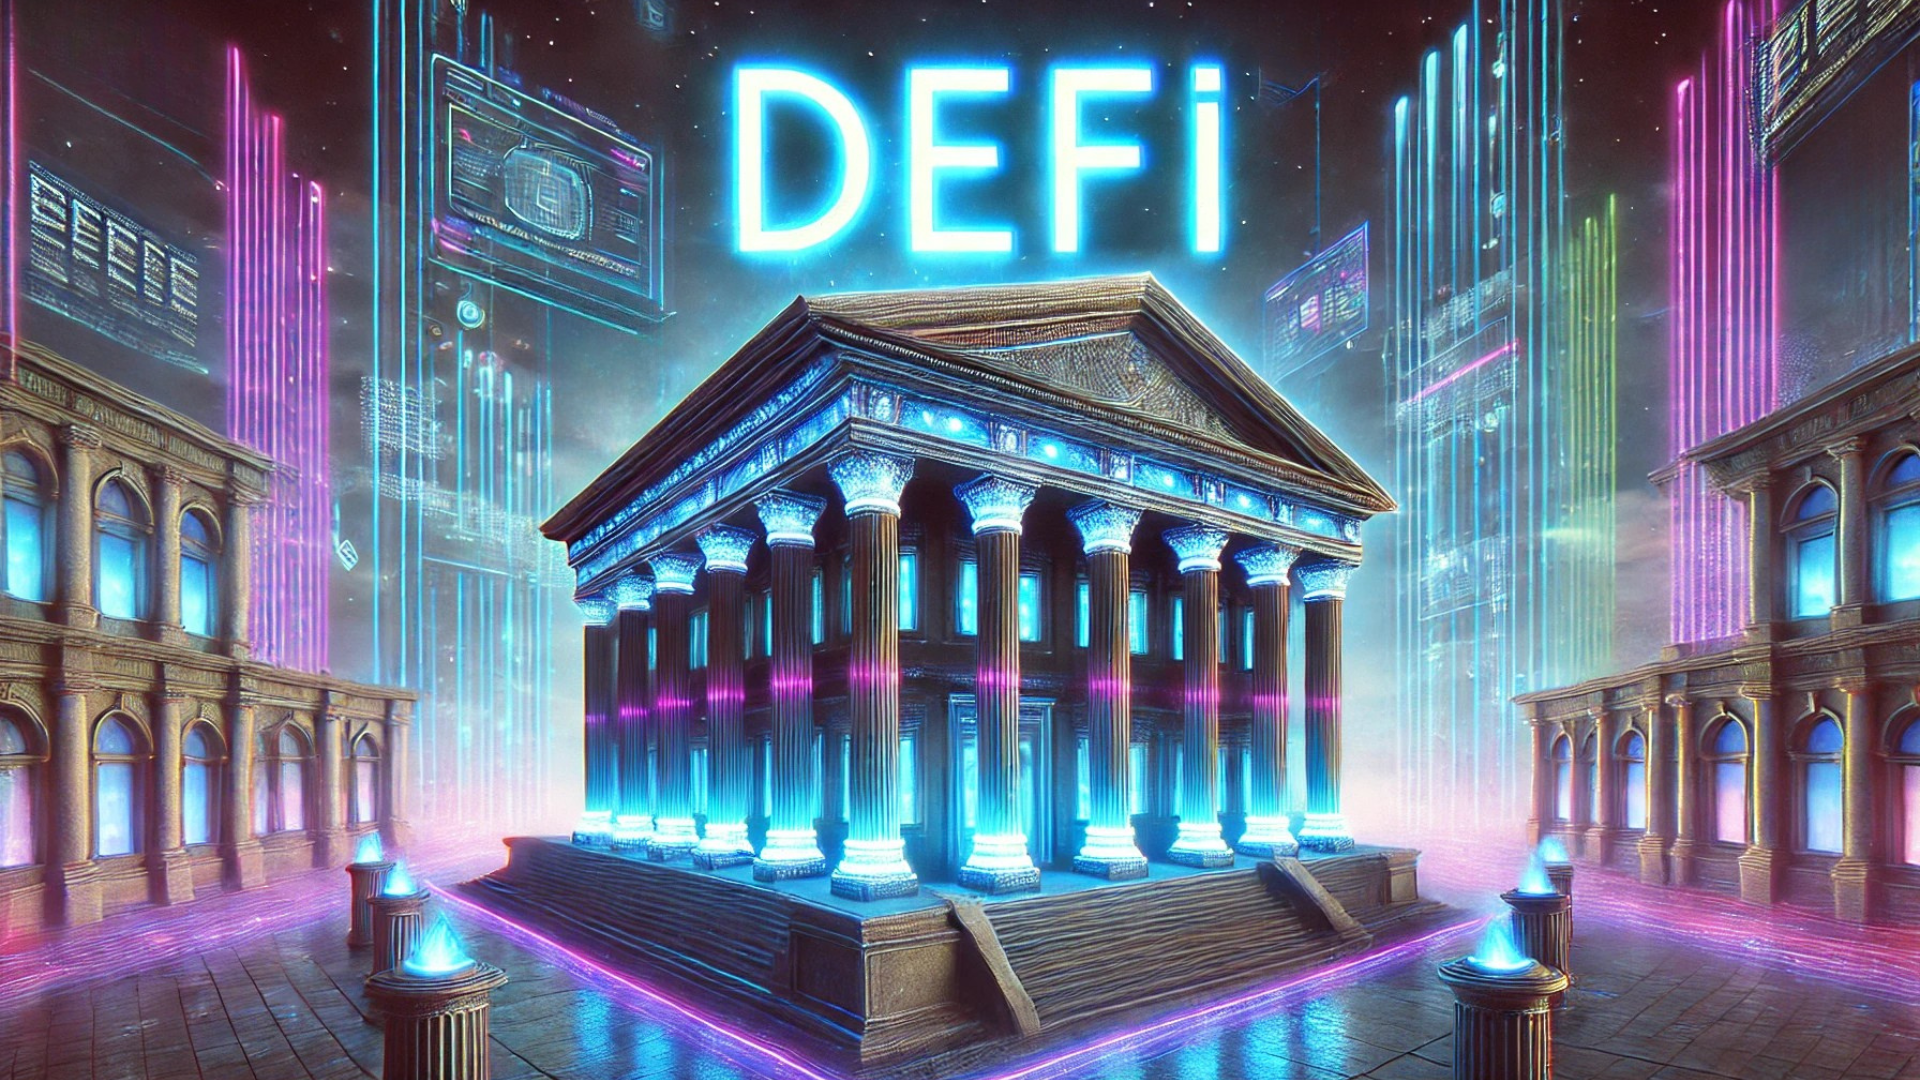
In decentralized finance (DeFi), Ethereum boasts \$133 billion in total value locked (TVL), commanding a dominant 62% market share. Its lead in tokenized treasuries, private credit markets, and blockchain-based financial infrastructure further supports its strong fundamentals.
Bullish Technical Patterns Take Shape
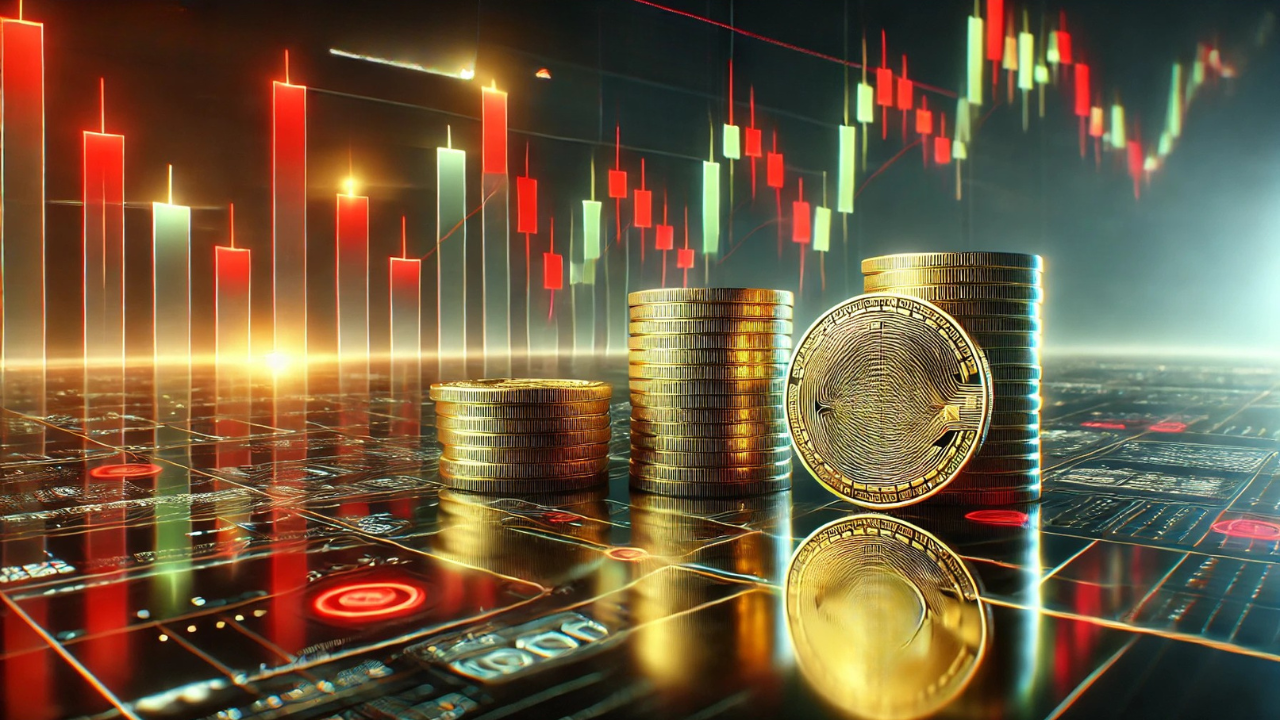
Multiple technical formations suggest a bullish scenario for ETH. The daily chart reveals a classic cup and handle pattern, with the neckline positioned around \$2,795 aligning closely with the 50% Fibonacci retracement level. This setup often signals a potential breakout to the upside once the handle completes.
Moreover, a golden cross has formed, where the 50-day moving average crosses above the 200-day average a pattern that historically precedes strong rallies. The last golden cross for Ethereum in November 2024 led to a 40% surge in price.
Additionally, Ethereum is exhibiting a bullish flag pattern, characterized by a sharp upward movement followed by sideways consolidation. This pattern typically resolves in the direction of the preceding trend upward in this case supporting the thesis of a breakout toward or beyond the \$2,800–\$3,000 level.
Macro Factors Also in Play
While crypto markets react to internal momentum, macroeconomic conditions remain a factor. U.S. stock indexes opened higher Thursday following news of a phone call between Presidents Trump and Xi, hinting at easing trade tensions. However, mixed economic signals rising jobless claims and declining productivity add to the market’s volatility.
Meanwhile, the European Central Bank cut interest rates for the seventh consecutive time, reducing its deposit rate to 2%. Such global monetary shifts may indirectly benefit crypto assets like Ethereum, which are increasingly seen as alternative investment hedges.
Final Thoughts
Ethereum’s current consolidation may be the calm before another bullish wave. With technical indicators aligning, institutional inflows accelerating, and Ethereum’s ecosystem dominance intact, the case for a near-term breakout continues to build. While macroeconomic headwinds persist, Ethereum’s position as the cornerstone of decentralized applications, stablecoins, and tokenized finance makes it one of the strongest assets in the digital economy.
Investors and traders alike will be watching closely to see whether ETH can break above the \$2,795 resistance and resume its upward march toward key psychological levels like \$3,000 and beyond.