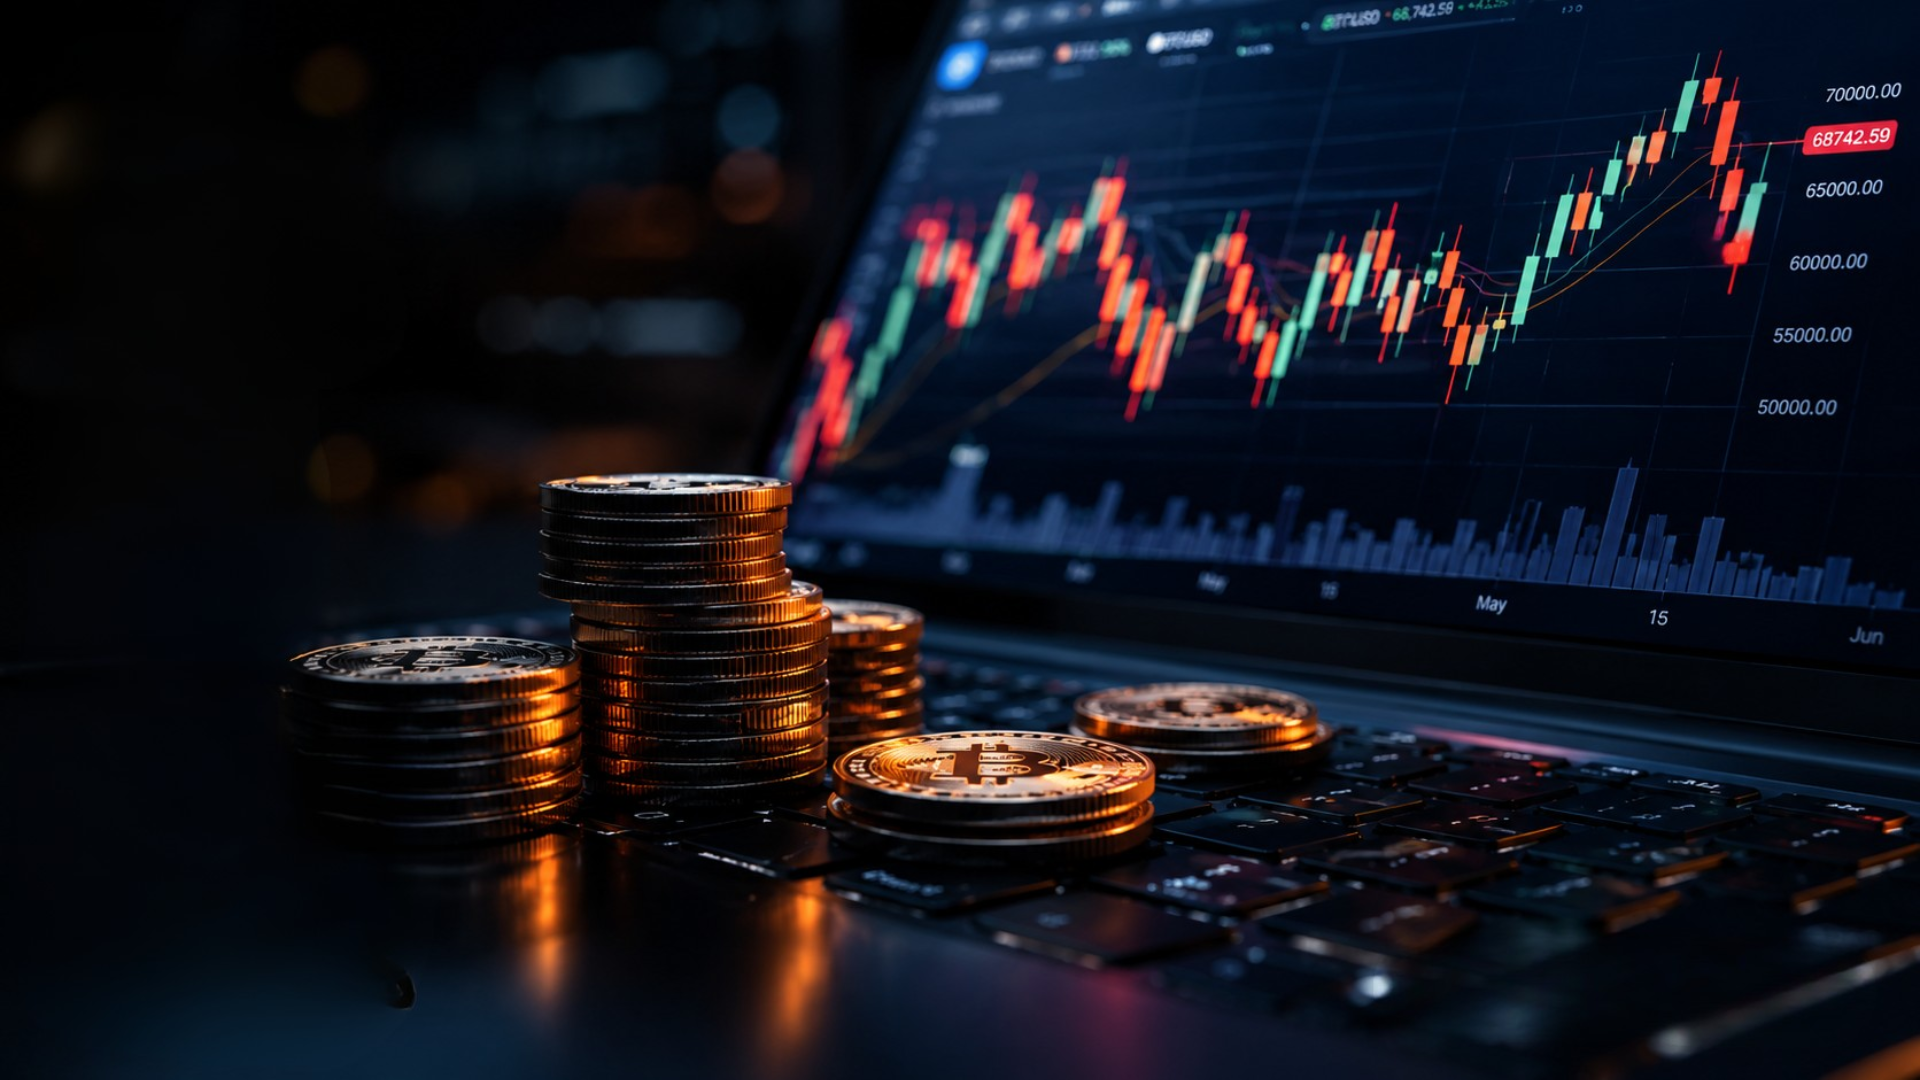
Bitcoin saw a brief pullback on Thursday, trading below $102,000 as traders took profits following a powerful multi-week rally. Despite the dip, on-chain data and technical indicators continue to support a long-term bullish outlook.
At press time, Bitcoin was trading at $102,716, down 3.35% from its 2024 high. The retreat mirrored losses across traditional markets, with futures tied to the Dow Jones, Nasdaq 100, and S&P 500 all down over 0.50%. There was no direct catalyst for the sell-off, reinforcing the view that the move was largely driven by short-term profit-taking after a more than 40% rally since April.
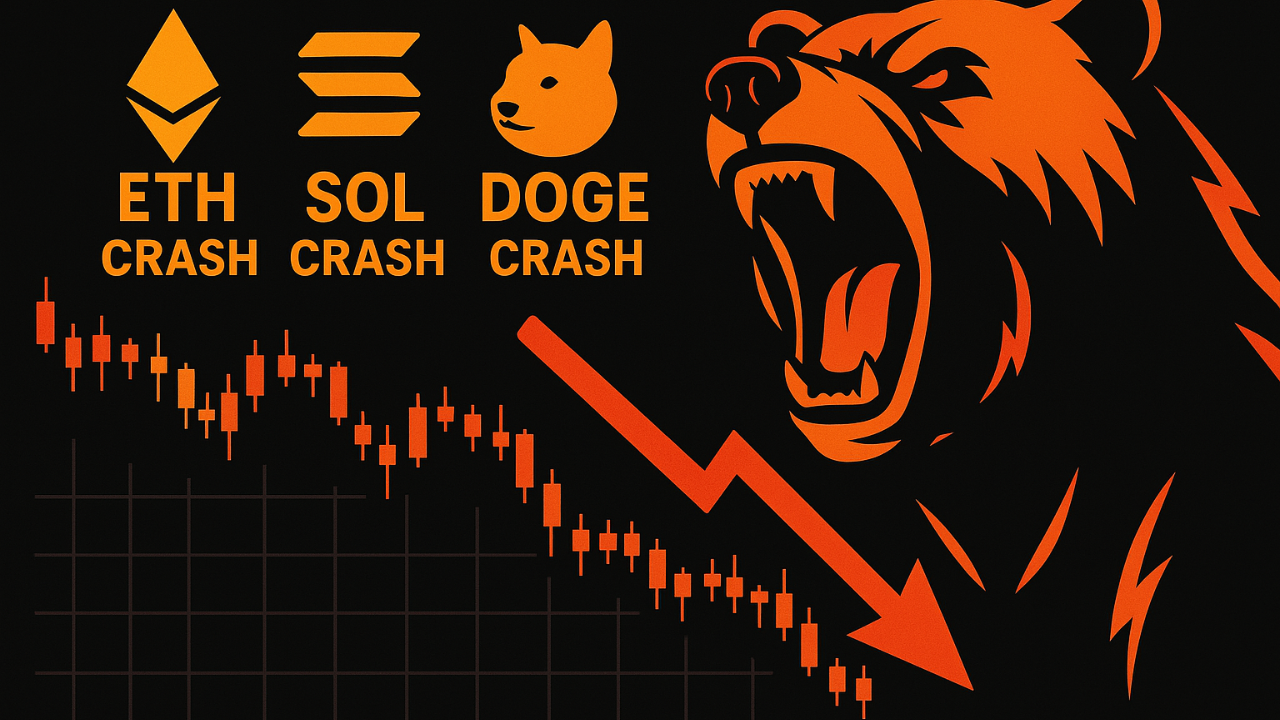
Altcoins Follow Bitcoin’s Lead
Bitcoin’s slide triggered broader weakness in the altcoin market. Ethereum dropped by 1.43%, Solana shed 2.25%, and Polkadot declined 3.13%, all experiencing steeper losses than BTC. The current consolidation phase comes after a strong rally across digital assets, suggesting a cooling-off period before potential renewed momentum.
Institutional Demand Still Rising
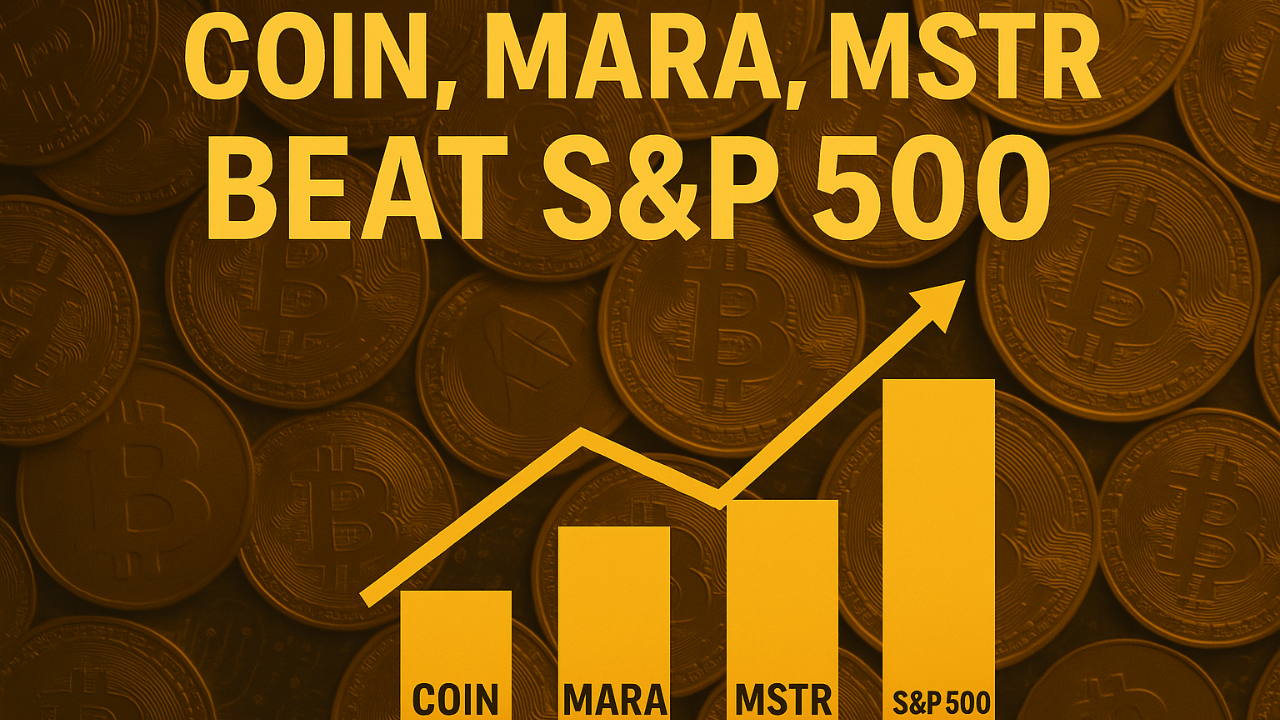
Despite the price dip, spot Bitcoin ETFs saw $319 million in net inflows on Wednesday, bringing cumulative inflows to over $41.4 billion since launch. Large players continue to accumulate MicroStrategy, led by Michael Saylor, has maintained its aggressive strategy, and Ukraine has emerged as a major holder with over 46,500 BTC worth $4.7 billion.
On-chain metrics support a bullish outlook:
- Exchange balances are at a 6-year low, signaling reduced sell pressure.
- Mining difficulty and hash rate continue to climb, reflecting growing network strength.
- Global M2 money supply growth supports increased liquidity in risk assets like Bitcoin.
Bullish Patterns on the Chart
Technically, Bitcoin is displaying several bullish formations. Analysts at crypto.news pointed to a cup-and-handle pattern on the daily chart often a precursor to a breakout. On the weekly chart, Bitcoin remains well above the 50-week EMA, a trend not broken since October 2023.
Also notable is a large megaphone pattern formed by diverging upward trendlines signaling potential for a major breakout. If Bitcoin breaches its all-time high of $109,300, analysts expect it to test $110,000 and possibly advance to $115,000. However, a move below the lower boundary of the megaphone could invalidate the bullish setup.
While Thursday’s dip signals a moment of consolidation, the macro and technical outlooks remain in Bitcoin’s favor. With strong institutional demand, declining exchange supply, and bullish chart setups, BTC appears poised for more upside pending confirmation through a breakout above its all-time high.